1.7 Tensor visualization
After performing all steps until calculation of the tensors (DDT file creation), the
tensors can be visualised in 3D space. Open human.vmr and load the DDT file
human31dir_vdw.dmr via DTI --> Diffusion Weighted Data Analysis -->
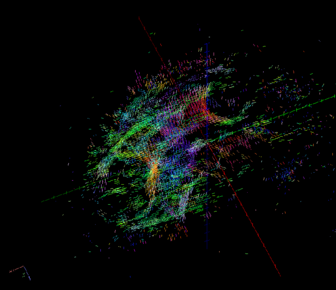
Browse. Close this window and go to DTI --> Tensor Visualisation. A new
main window opens and the tensor data is visualised as color coded lines. Color coding
is identical to that of a FA/MD direction color coded map. The lines represent the major
direction of the diffusion tensor. You may want to adjust the amount of visible tensors by
de- or increasing the FA threshold.
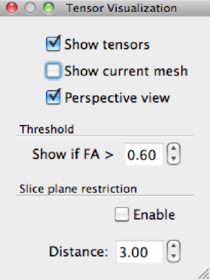
Show Tensors | check/uncheck to show/hide tensors |
Show current mesh | check/uncheck to show/hide a mesh |
Perspective view | check/unchek to view data in perspective or
not in perspective. Also activated by pressing
P on your keyboard. |
Threshold | FA threshold for tensor display. High
threshold → few tensors and vice versa |
Slice plane restriction | show only tensors limited to a slice plane,
within a certain distance in mm from a slice.
See text for instructions. |
| |
You can navigate in 3-D space using the following gestures:
| gesture | effect |
|
|
| hold left + move mouse | rotation |
| hold right + move mouse | translation |
| hold left + right + move mouse | zoom |
| |
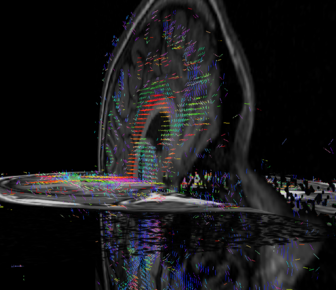
The tensor view may also be limited to a slice instead of the whole volume. First,
display one or more slices by clicking or (Shift)-clicking one of the “cut”-buttons
listed below. Brainvoyager will show you the selected slice, and by checking the Slice
plane
restriction box, the tensors will be limited to the slice(s) selected. You can move the
slices by the Alt+hold left click+move mouse key combination. In figure 1.6.b
the view is shown.