An example of using VOI statistics is given in this section. First, make sure you have a VMR and a FA or MD map loaded. Either create a VOI first, or point to Analysis --> Region of Interest Analysis to open the VOI dialog and load previously defined VOIs, either drawn or created by backprojection of fibers on a VMR.
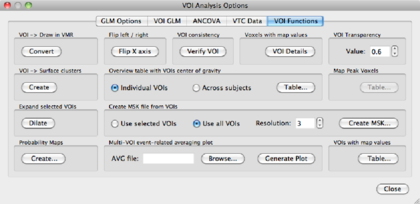
Because a FA/MD map is loaded, BV can extract the FA/MD values at the VOIs. Open the VOI dialog if you haven’t done this already. To show the data, select the VOI of your choice (here: corpus callosum) and click Options in the lower-right corner of the window. In the VOI Analysis Options dialog, go to the VOI functions tab.
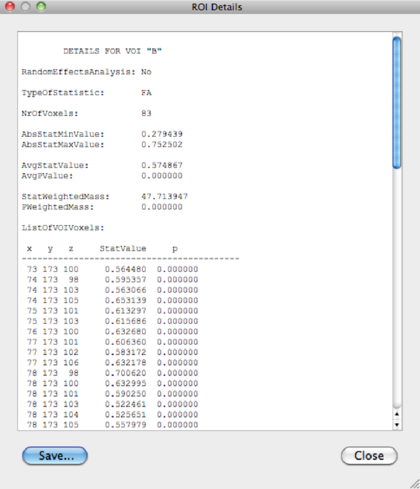
Click the VOI details button and a window showing (in this example) the FA values of the VOI at all voxel locations is displayed, in column StatValue 1.
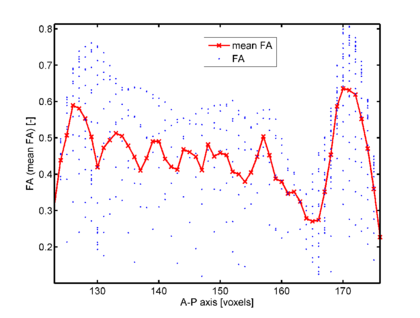
The details can be saved as a textfile, and then processed outside of BV, for instance to show the FA profile of the corpus callosum in figure 1.10.