RFX of Conjunction vs. Conjunction of RFX
- Details
- Category: Second Level Statistics
- Last Updated: 11 April 2018
- Published: 11 April 2018
- Hits: 4142
BrainVoyager version used: BV QX 1.8.6
Dataset used: Simulated data, Groupdata simulator version 1.0 (Design_1W.gds)
In the context of a Random Effects Analysis, one can decide to combine multiple contrasts via a conjunction analysis. For this analysis, the options are to either use
a) ”Conjunction of Random effects” or
b) “Random Effects of conjunction”.
In this document, we will try to explain and externally validate the difference betweens these approaches.
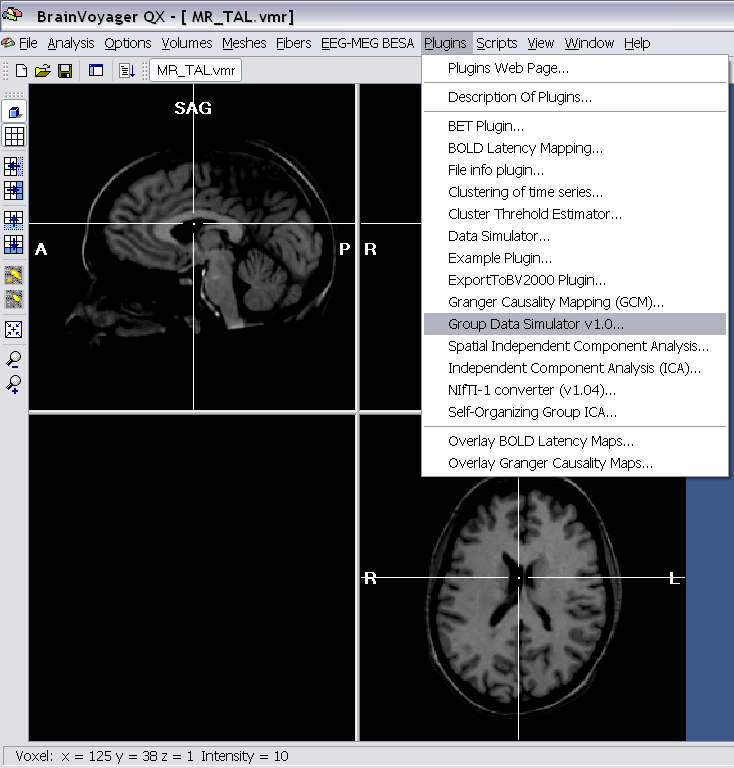
1. First of all, we open a VMR project.
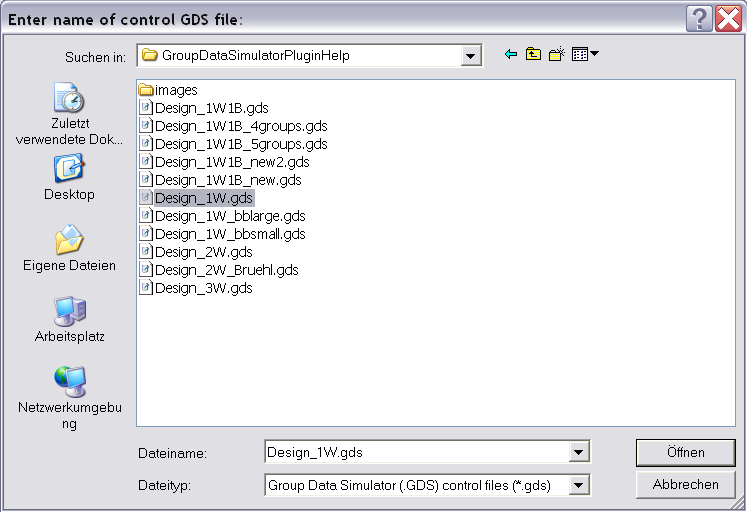
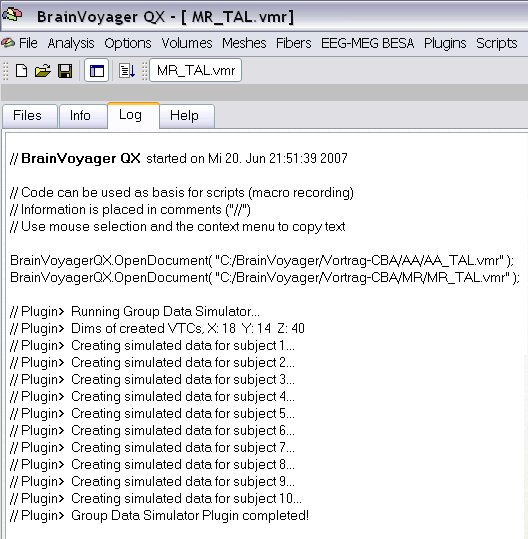
2. We use the group data simulator to create a simulated dataset.
We use the GDS file “Design_1W.gds” to simulate VTC and RTC files for 10 subjects.
3. We open the Multi-Study GLM dialog and define a Multi-Study Design Matrix. We save it as “10Subs_RFX.mdm”.
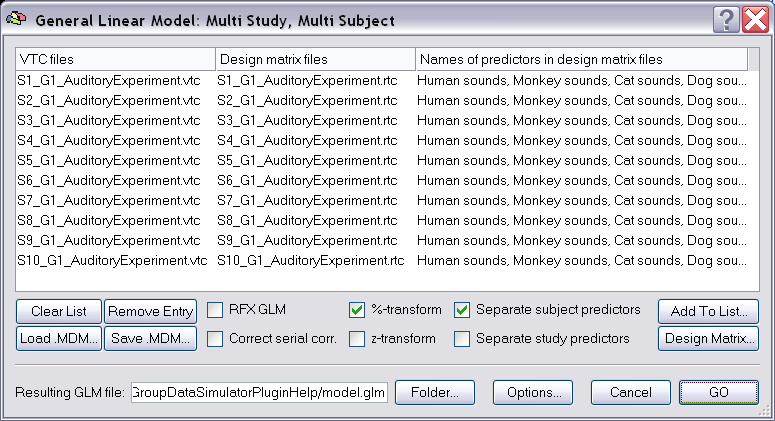
4. We run the first level of a summary statistic Random Effects Analysis,so we only separate the subjects, but not use the RFX GLM checkmark.
The results show quite isolated regions in the left and right hemisphere, based on the way the data has been simulated. We open the Overlay GLM dialog.
5. We specify a first contrast of interest, e.g. “Human sounds (+)”
By using the CTRL button, we define the same contrast for any of the 10 simulated datasets.
To be able to run a conjunction analysis, we need at least a second contrast of interest, so we add a second contrast page using the “Add contrast” button.
On this second page, we define the contrast “Monkey sounds (+)”.
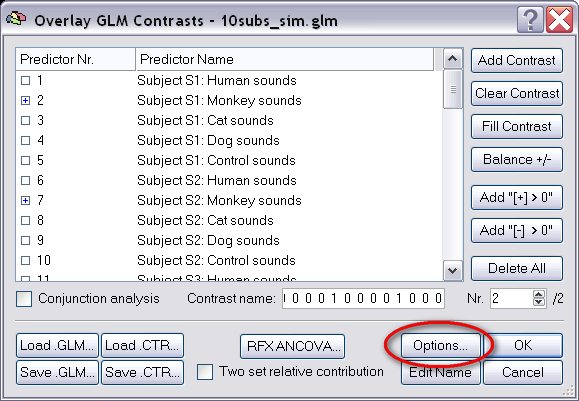
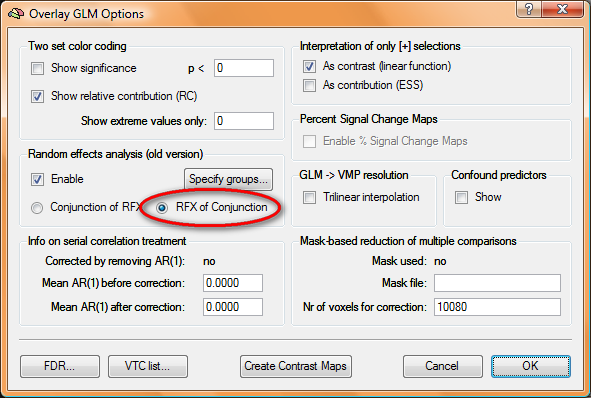
6. To run the conjunction analysis, we have to use the corresponding checkmark on the Overlay GLM dialog. To run a combination of Random Effects Analysis and Conjunction, we need to open the Options of the Overlay GLM dialog first.
We find the Random Effects option on the left side of the dialog. We enable the Random Effects Analysis.
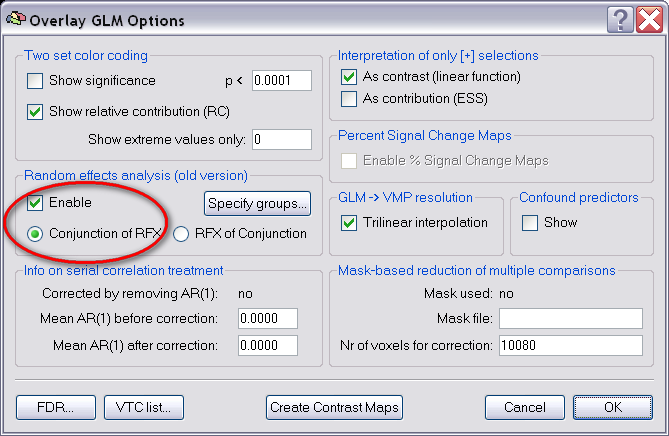
Automatically, the option “Conjunction of RFX” is chosen.
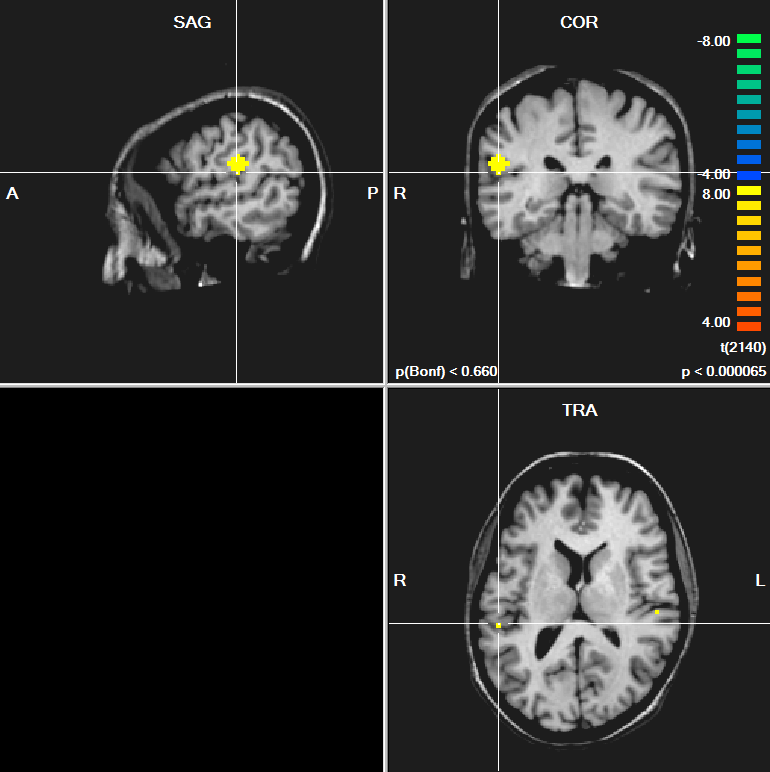
7. We checkmark the Conjunction analysis in the main “Overlay GLM“ dialog and run the contrast by clicking “OK“. Observing the results, we find a significant cluster on the left hemisphere.
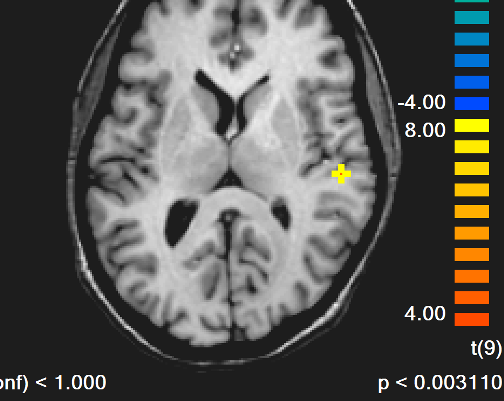
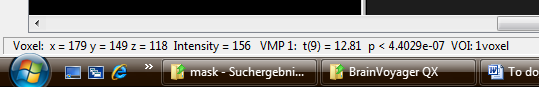
8. We select a single voxel of the cluster (depicted in red) and find the coordinate of the selected voxel (x = 179, y = 149, z = 118) as well as the assigned statistical value (t = 11.57) in the task bar of BrainVoyager.
9. To extract the values of the contrasts for the separate subjects, we define a VOI consisting of this single voxel (to avoid possible interpolation).
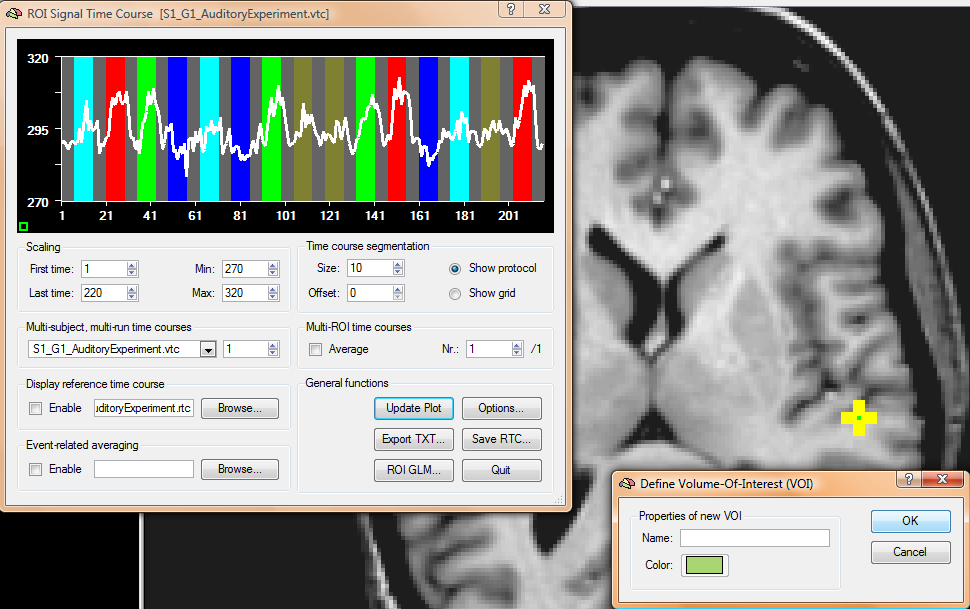
10. We save the region of interest as “1voxel”.
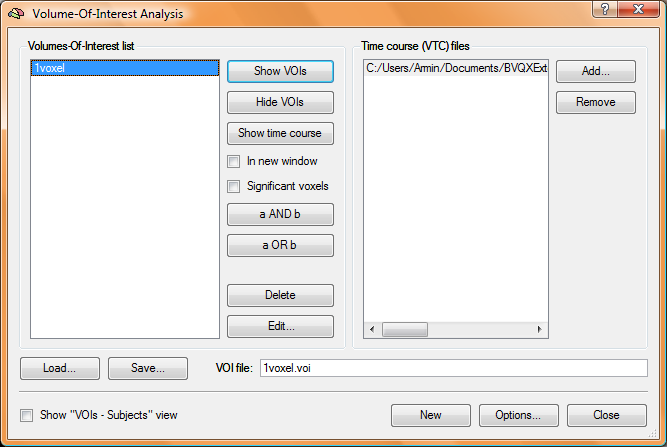
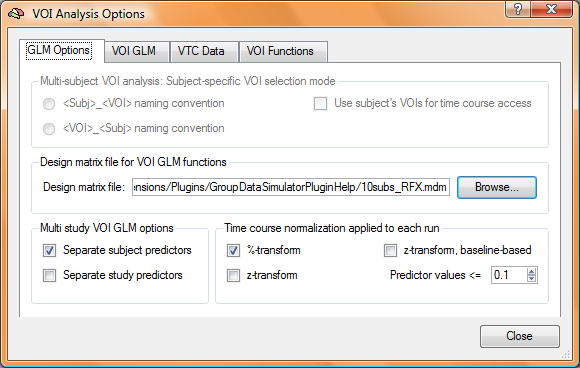
11. We open the Options of the ROI analysis tool and load the previously specified MDM file (used for the full brain analysis) – 10subs_RFX.mdm.
12. On the VOI GLM tab, we click the VOI GLM button.
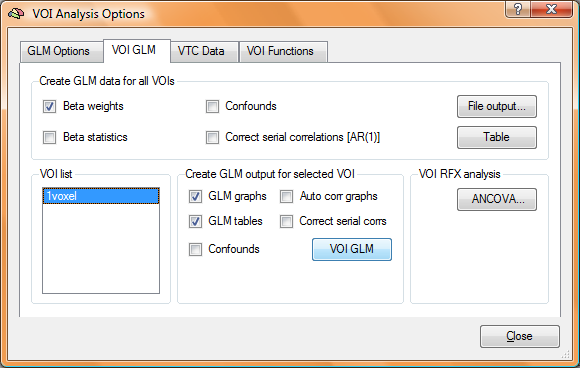
We use percent signal change transformation for the time course normalisation and open the RFX tab.
On the ROI GLM specification dialog, we separate the subject predictors and enable RFX analysis of contrasts.
We open the Contrasts tab and specify first the contrast “Human Sounds (+)” for all the different subjects. Using the “Add contrast” button, we add the contrast “Monkey sounds” as the second contrast.
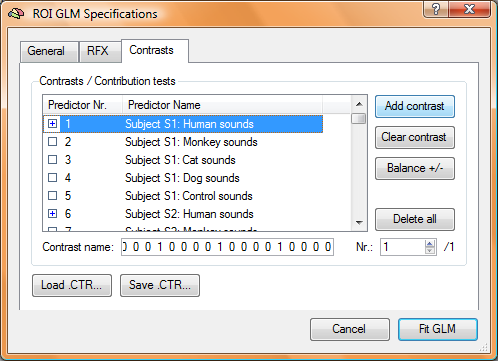
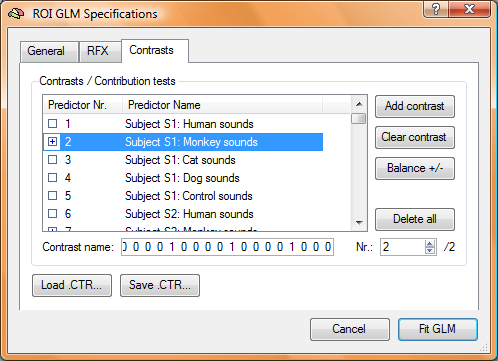
We start the analysis using the “Fit GLM” button.
13. We obtain an extended output file containing the Anova result for the specified model in the selected region, the specific beta weights, se and t values for the single predictors (separated by subjects as specified in the MDM file) as well as the random effects contrast in the lower part of the HTML file.
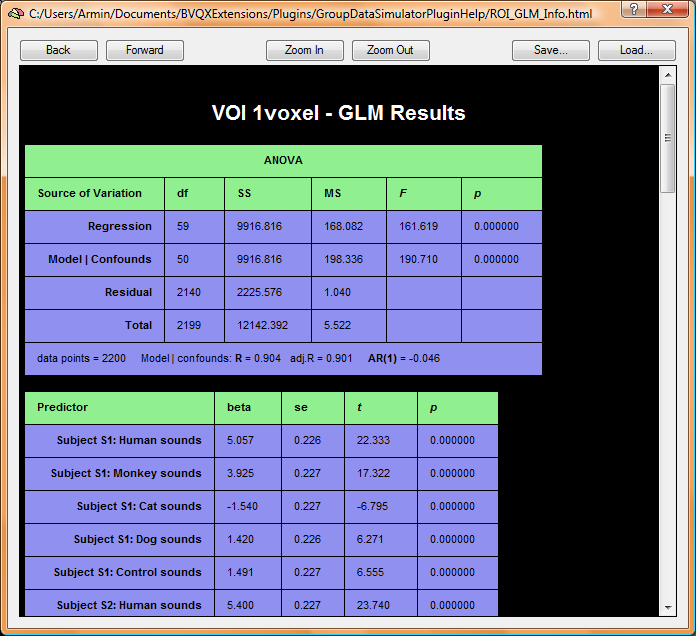
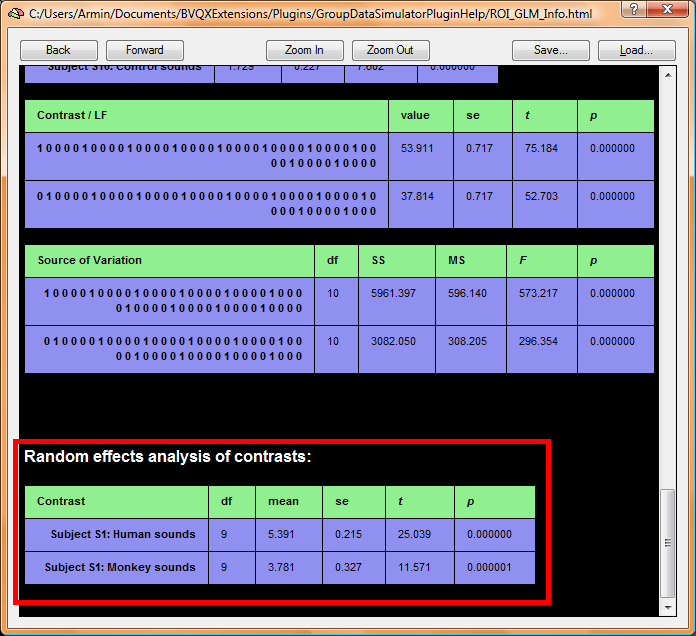
This results represents the basis for the conjunction of RFX approach, namely the minimum t-statistic based on the previous RFX contrast of the two assigned contrasts (in this case Human sounds and Monkey sounds).
The minimum t in this case is 11,571, which is the same value we have obtained in the analysis of the goal voxel when using the Conjunction of RFX approach.
14. Now, we go back to the “full brain” analysis and perform the second option, namely the “RFX of conjunction” approach.
Using this alternative approach, we obtain a value of 12,81 (compared to 11,57) for the same voxel selected before (x = 179, y = 149, z = 118).
How can we account for this difference between the values?
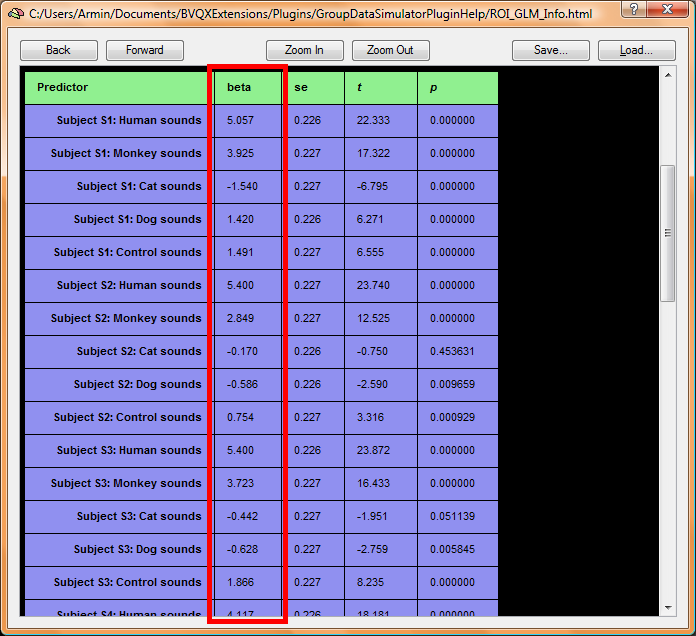
The “RFX of Conjunction” approach performs – compared to the “Conjunction of RFX” approach the conjunction first (before running the RFX analysis). This means the single pairs of contrasts are compared within each subjects first. To validate this, we have to extract the beta values first. These values were already contained in the previous steps of analysis (when we extracted the statistical values for the specified voxel).
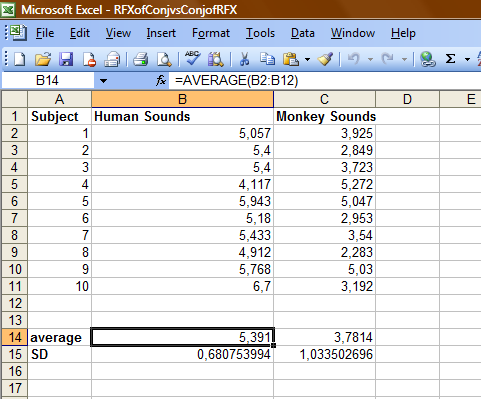
15. We can save the output file (as an HTML format) and import the data e.g. into Excel to perform an external validation.
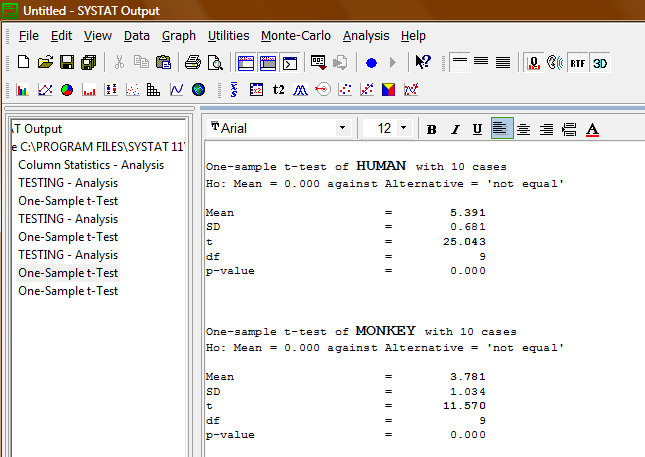
16. We import the same data into a statistical package (Systat) and obtain the same result as has previously been shown in BrainVoyager.
17. To reconstruct a conjunction on the single subject basis before running the random effects analysis, we use the values imported into Excel and compared the values pairs for each single subject.
When comparing the values, it becomes clear that for the simulated subject 4, the beta / t-value for the contrast human sounds is smaller than for the contrast monkey sounds (while for all other subjects, it is vice versa).
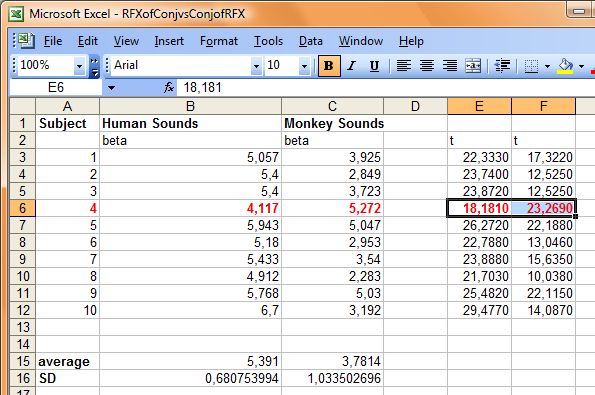
18. To comply with the conjunction idea at the single subject level, we use only the minimum values of every subject, which means we use the 4,177 instead of 5,272 in case of subject 4 before running the Random Effects analysis.
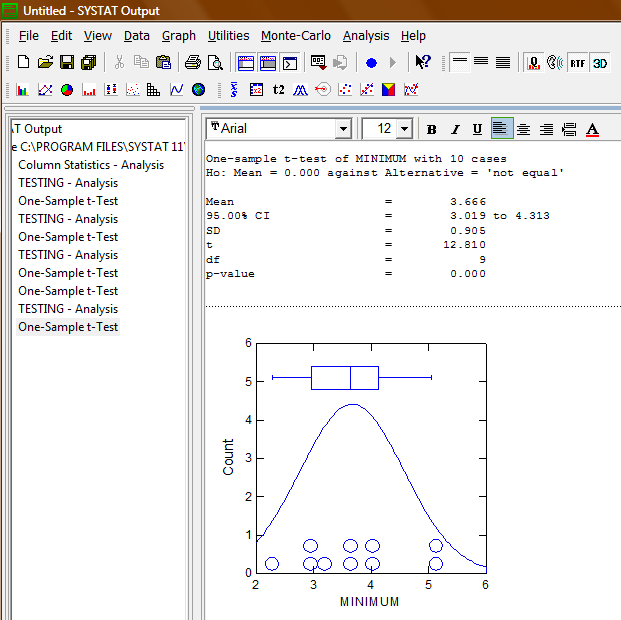
Using the new variable gained on the basis of this adaption, we run again a one sample t-test and obtain the following result. We obtain a t-value of 12,81, which is exactly the same value as reported by BrainVoyager.
Summary
While utilizing the “Conjunction of RFX” approach, BrainVoyager performs the conjunction step on the basis of the results of the Random effects analysis (basically just comparing the resulting t-values in the end). Compared to that, it will first perform the conjunction in every single subject before running the random effects analysis when the “Random Effects of Conjunction” approach is selected. Depending on how different the pattern of results is between the subjects (or how homogeneous the sample is), the results of these approaches will differ more or less.
Conjunction of Random Effects
Random Effects of Conjunction