Checking DMR data quality
- Details
- Category: DMR creation
- Last Updated: 16 April 2018
- Published: 16 April 2018
- Hits: 1873
An easy way to check the quality of your DWI dataset is to look at the standard deviation across diffusion weighted volumes and/or b0 volumes. If there are, for instance, large motion or eddy current artefacts in your data, they will show up as bright rims in the standard deviation map. More information can be found in the paper
Jacques-Donald Tournier, Susumu Mori, Alexander Leemans, Diffusion tensor imaging and beyond, Magnetic Resonance in Medicine Volume 65, Issue 6, pages 1532–1556 DOI
A tool to calculate the standard deviation in Matlab is available. Steps to take are
- Download and install BVQXtools or Neuroelf from www.neuroelf.net
- Download stdevDWI.zip, extract the m-file and put it somewhere where Matlab can see it.
- Create a DMR from your data and make sure the gradients are defined.
- In Matlab, run >> stdevDW
- The function will ask for a DMR and whether the DMR needs to be masked for visualisation purposes.
- Output will be 2 maps: _stdDW.map and _stdb0.map
- In BrainVoyager, load a DMR and overlay the maps via Analysis > Overlay Volume Maps.
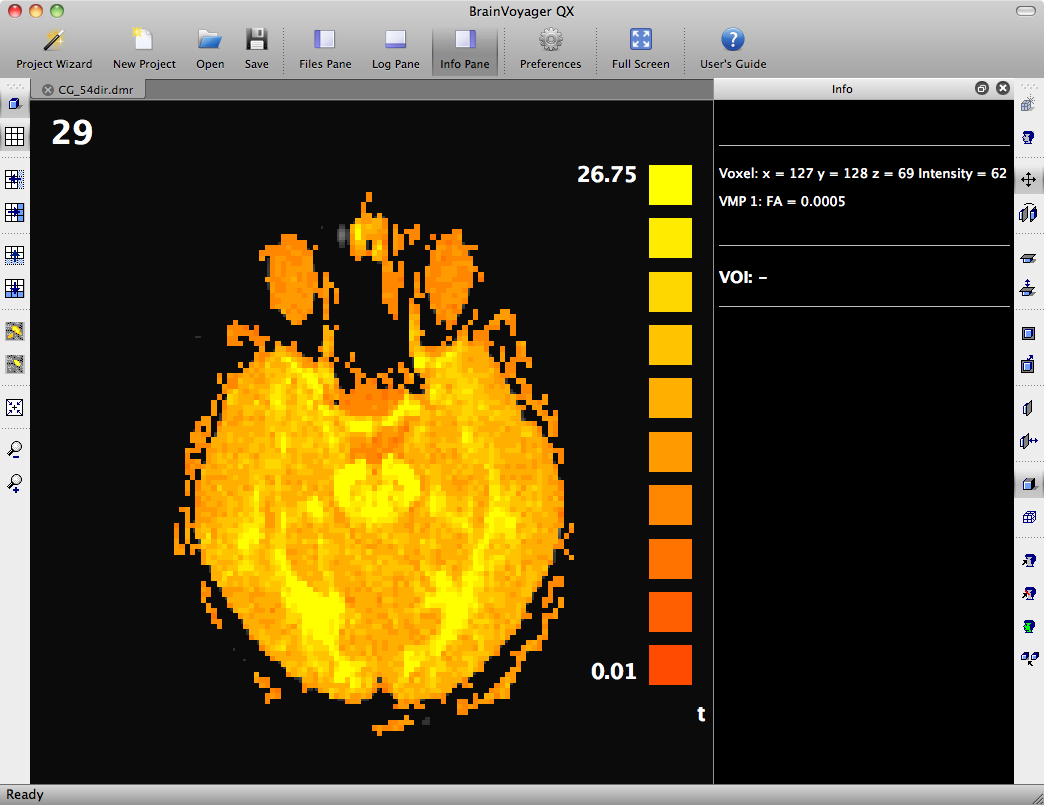
Example
This shows the standard deviation map for diffusion weighted volumes. No artefacts were found in this dataset. Note that the "t" value displayed in the lower right corner is not valid, this should be "stdev (DWI)".